UBC Faculty Data Visualizations
WHEN:
June 2019 - July 2019
WHAT:
Personal Project
TOOLS:
June 2019 - July 2019
WHAT:
Personal Project
TOOLS:
- Javascript
- Python
- Node.js
- Bootstrap
- D3.js
- Heroku
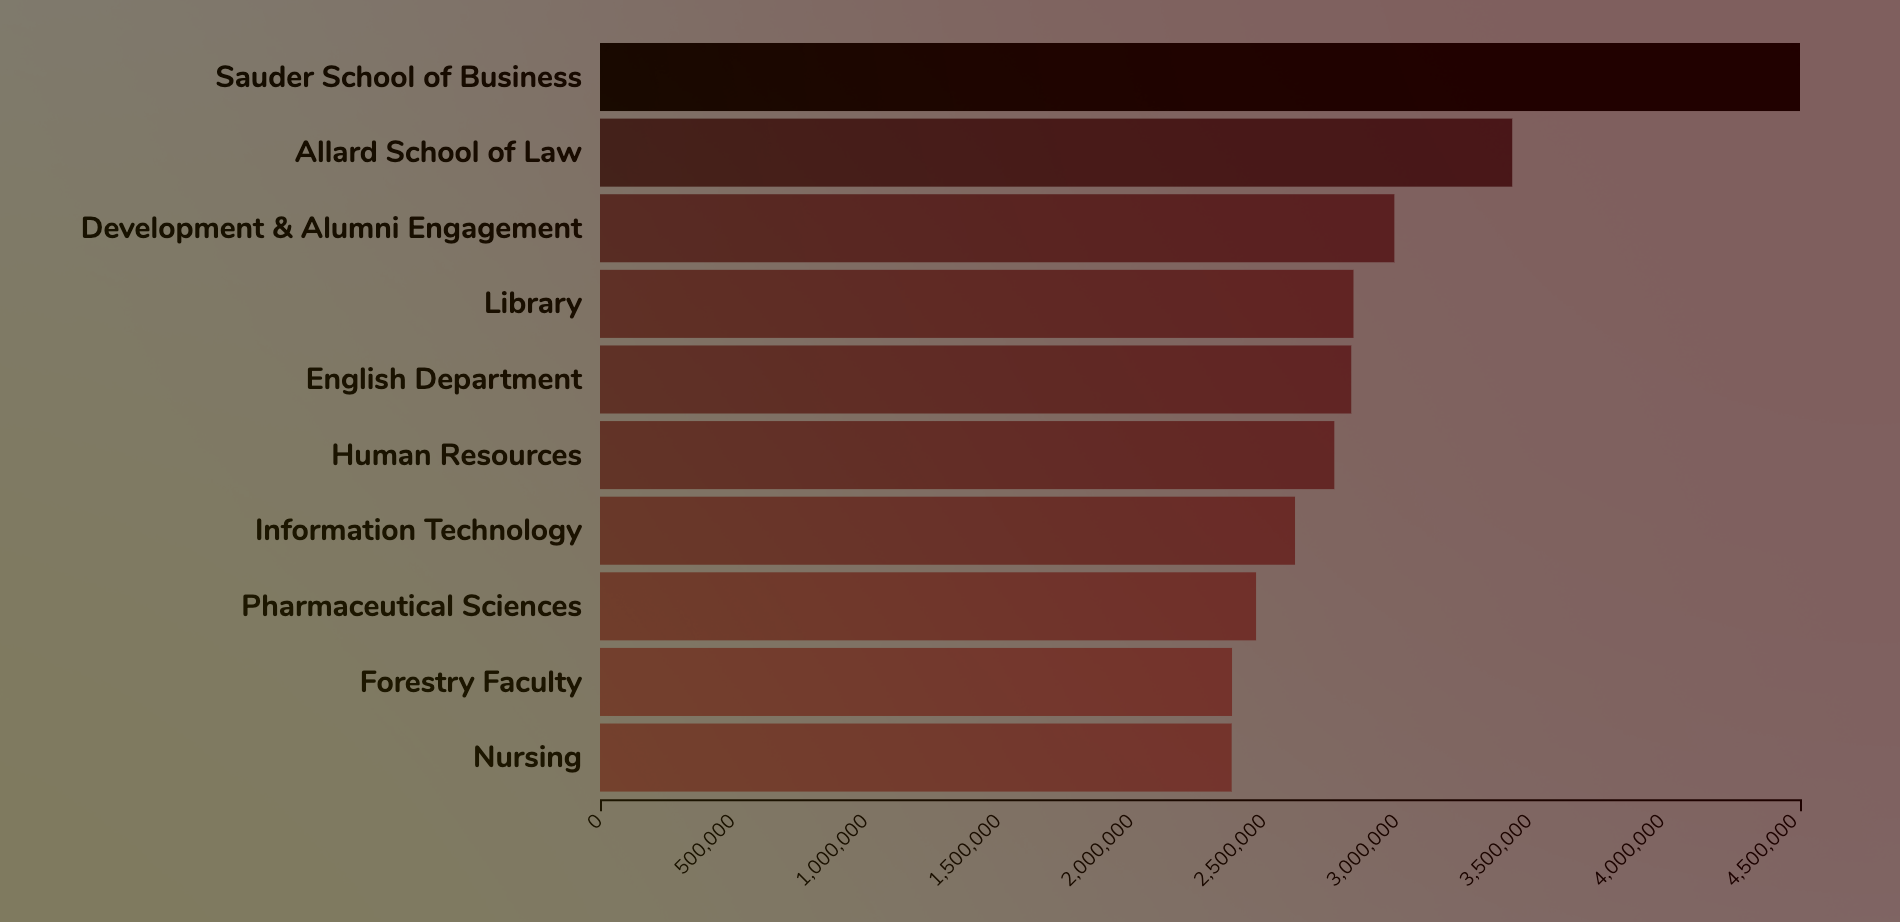
This was a personal project done over summer that stemmed from my and a few others' curiosity on gender differences for faculty renumeration at UBC. This also served as a good exercise for me to learn python!
I first extracted faculty data by parsing the UBC 2018 faculty report in python. Using this data, I then made a python web-crawler to make POST requests on the UBC faculty directory to extract information like department and position.
The final data was aggregated into a CSV file, with which I used D3.js to create visualizations based on gender, position and department. The project is deployed on Heroku.
>> Website <<